Querying Metrics from Prometheus
This task shows you how to query for Istio Metrics using Prometheus. As part of this task, you will use the web-based interface for querying metric values.
The Bookinfo sample application is used as the example application throughout this task.
Before you begin
Install Istio in your cluster and deploy an application.
Querying Istio Metrics
Verify that the
prometheusservice is running in your cluster.In Kubernetes environments, execute the following command:
$ kubectl -n istio-system get svc prometheus
NAME         CLUSTER-IP     EXTERNAL-IP   PORT(S)    AGE
prometheus   10.59.241.54   <none>        9090/TCP   2m
Send traffic to the mesh.
For the Bookinfo sample, visit
http://$GATEWAY_URL/productpagein your web browser or issue the following command:$ curl http://$GATEWAY_URL/productpageOpen the Prometheus UI.
In Kubernetes environments, execute the following command:
$ kubectl -n istio-system port-forward $(kubectl -n istio-system get pod -l app=prometheus -o jsonpath='{.items[0].metadata.name}') 9090:9090 &Visit http://localhost:9090/graph in your web browser.
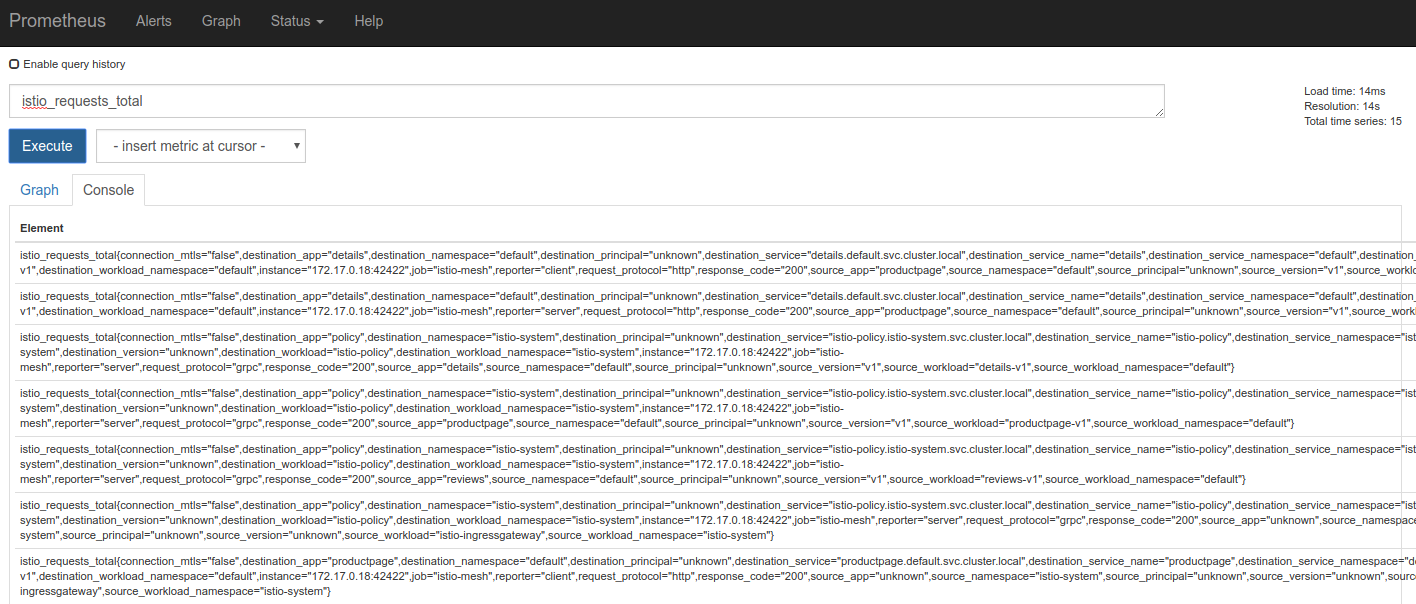
Execute a Prometheus query.
In the “Expression” input box at the top of the web page, enter the text:
istio_requests_total. Then, click the Execute button.
The results will be similar to:
Other queries to try:
Total count of all requests to the
productpageservice:istio_requests_total{destination_service="productpage.default.svc.cluster.local"}Total count of all requests to
v3of thereviewsservice:istio_requests_total{destination_service="reviews.default.svc.cluster.local", destination_version="v3"}This query returns the current total count of all requests to the v3 of the
reviewsservice.Rate of requests over the past 5 minutes to all instances of the
productpageservice:rate(istio_requests_total{destination_service=~"productpage.*", response_code="200"}[5m])
About the Prometheus add-on
Mixer comes with a built-in Prometheus adapter that exposes an endpoint serving generated metric values. The Prometheus add-on is a Prometheus server that comes preconfigured to scrape Mixer endpoints to collect the exposed metrics. It provides a mechanism for persistent storage and querying of Istio metrics.
The configured Prometheus add-on scrapes the following endpoints:
istio-telemetry.istio-system:42422: Theistio-meshjob returns all Mixer-generated metrics.istio-telemetry.istio-system:15014: Theistio-telemetryjob returns all Mixer-specific metrics. Use this endpoint to monitor Mixer itself.istio-proxy:15090: Theenvoy-statsjob returns raw stats generated by Envoy. Prometheus is configured to look for pods with theenvoy-promendpoint exposed. The add-on configuration filters out a large number of envoy metrics during collection in an attempt to limit the scale of data by the add-on processes.istio-pilot.istio-system:15014: Thepilotjob returns the Pilot-generated metrics.istio-galley.istio-system:15014: Thegalleyjob returns the Galley-generated metrics.istio-policy.istio-system:15014: Theistio-policyjob returns all policy-related metrics.istio-citadel.istio-system:15014: Theistio-citadeljob returns all Citadel-generated metrics.
For more on querying Prometheus, please read their querying docs.
Cleanup
Remove any
kubectl port-forwardprocesses that may still be running:$ killall kubectlIf you are not planning to explore any follow-on tasks, refer to the Bookinfo cleanup instructions to shutdown the application.